
The June 2019 T-Point Price Index rose 0.02 points from the previous month, reaching a record high of 2.17% year-on-year for the third consecutive month.
2019.07.11
Press Releases
CCC Marketing Co., Ltd. / Culture Convenience Club Co., Ltd.
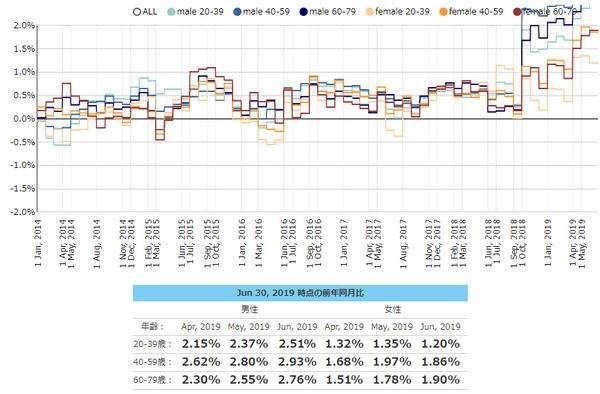
The largest increase was for men aged 40-59 at 2.93%, while the smallest was for women aged 20-39 at 1.20%.
CCC Marketing Co., Ltd. and Culture Convenience Club Co., Ltd., which operate a marketing platform business, have announced the "T-POINT Price Index" (hereinafter "TPI"), a price index that utilizes T-Point data, as part of a joint project with the Watanabe Tsutomu Laboratory at the Graduate School of Economics, The University of Tokyo. We are pleased to announce the TPI for June 2019.
Digest of the T-Point Price Index for June 2019
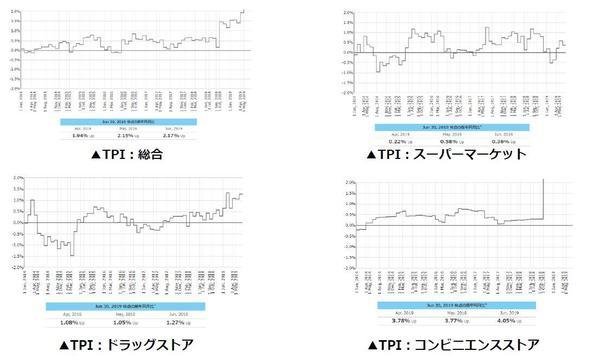
●Up 0.02 points from the previous month, the year-on-year increase was 2.17%, the highest in three consecutive months.
TPI uses the amount of purchases made using T Cards at T Point partner stores such as supermarkets, drugstores, convenience stores, and restaurant chains. The TPI for June 2019 was 2.17% compared to the same month last year, marking a new record high for the third consecutive month, and remaining in the 2% range for the second consecutive month. By business type, supermarkets fell 0.22 points from the previous month, which had been on an upward trend, to 0.36% compared to the same month last year. Meanwhile, drug stores rose 0.22 points from the previous month to 1.27% compared to the same month last year, and convenience stores rose 0.28 points from the previous month to 4.05% compared to the same month last year, reaching the 4% range for the first time since data collection began.
The largest increase was among men aged 40-59 at 2.93%, while the smallest was among women aged 20-39 at 1.20%.
Looking at the TPI for June 2019 by gender and age group, in order of the largest increase compared to the same month last year, was 2.93% for men aged 40-59, followed by 2.76% for men aged 60-79, 2.51% for men aged 20-39, 1.90% for women aged 60-79, and 1.86% for women aged 40-59. The smallest increase was 1.20% for women aged 20-39. Overall, the price index for men of all age groups rose for the third consecutive month, remaining in the 2% range, while the price index for women fell for those aged 20-39 and 40-59, and rose for those aged 60-79. By business type, "supermarkets" saw an increase among men aged 20-39 and 40-59, while others saw a decrease. Additionally, "drug stores" and "convenience stores" saw increases across all age groups and for both men and women. At convenience stores, the figure is in the 4% range for both men and women aged 40-59 and 60-79, excluding younger generations.
■ Daily index https://www.cccmk.co.jp/tpi/data1.html
■Monthly index https://www.cccmk.co.jp/tpi/data2.html
*You can view data by selecting from three business types: "supermarket," "drugstore," and "convenience store."Please note that "restaurant chains" cannot be selected and viewed by business type.
*Daily index data is up to three days prior.
What is TPI?
The Consumer Price Index (CPI) is known as an economic thermometer that indicates economic trends. On the other hand, the TPI is an index compiled based on purchase price data accumulated daily through T-Point partner stores across Japan. Specifically, this price index was derived by aggregating, tabulating, and analyzing purchase amounts obtained from T-Card purchasing data, which is used by 69.46 million people across Japan (number of members after name matching as of the end of May 2019) and has related sales of over 8 trillion yen, which accounts for approximately 2% of Japan's total consumption.
About TPI
The data currently used by TPI collects the amount of purchases involving T-Cards at T-Point partner stores such as supermarkets, drugstores, convenience stores, and restaurant chains. The store areas are as follows: supermarkets are mainly in the Tokyo metropolitan area and Kyushu, drug stores are mainly in Kanto, Kansai and Kyushu, and convenience stores and restaurant chains are nationwide. Currently, the number of products (SKUs) covered by TPI is approximately 110,000, with 191 of the 580 items being utilized, resulting in a coverage of 23.4% when the Ministry of Internal Affairs and Communications CPI is taken as 100%. The amount used to calculate TPI is excluding consumption tax (excluding tax). Additionally, while no special consideration is given to sale items, all products with sales history for both the previous and current periods are used to compile TPI. Please note that the number of members covered by TPI, as well as the transaction amount and number of uses, have not been disclosed.
TPI Features
The features of TPI are that it allows you to see the price index by gender and age group, and that it is a price index based on buying prices rather than selling prices. The TPI is calculated using the Tornqvist method, which is the same as the University of Tokyo Daily Price Index. This calculation method places more weight on products purchased in larger quantities, and there is a consensus among researchers that it is the best method for creating a price index.
[Disclaimer]
*These results are from a beta version and may be subject to change without notice.
*This information is not intended for use in any investment or economic transactions, and no express or implied guarantees are made, including as to its commercial usefulness or usefulness for any particular purpose.
*Please fully understand the nature of this index and use it at your own risk.
*We are not responsible for any losses resulting from investments or transactions based on this index.
*We do not assume any liability (direct or indirect) arising from the use of this index.
*No representations or warranties are made regarding the accuracy, completeness, precision, reliability, etc. of this index.
*Reproduction of this content without permission is strictly prohibited.
Materials related to this matter
The June 2019 T-Point Price Index rose 0.02 points from the previous month, reaching a record high of 2.17% year-on-year for the third consecutive month.
Inquiries regarding this matter
■ Inquiries regarding TPI
CCC Marketing Co., Ltd. Data Science Lab
MAIL: tpi-pj@ccc.co.jp
■Inquiries from the press
CCC Marketing Co., Ltd.
Public Relations Officer: Ando and Nakagawa
TEL: 03-6800-4464
If you resonate with the content of this site, please feel free to share it.


