
"Reiwa Consumption Survey" 70% of people said they "spent more money than usual in 2019," with the most expensive purchases being 1st "travel," 2nd "cars," and 3rd "computers."
2019.12.26
Press Releases
Culture Convenience Club Co., Ltd.
- 20% of people received increased bonuses, and 50% of people increased their cashless payments compared to before the tax increase.
Culture Convenience Club Co., Ltd. is pleased to announce that it has conducted a "Survey on Consumption in the Reiwa Era" using the online survey "T Survey" with 1,502 men and women aged 18 to 69.
Reiwa Consumption Survey Digest
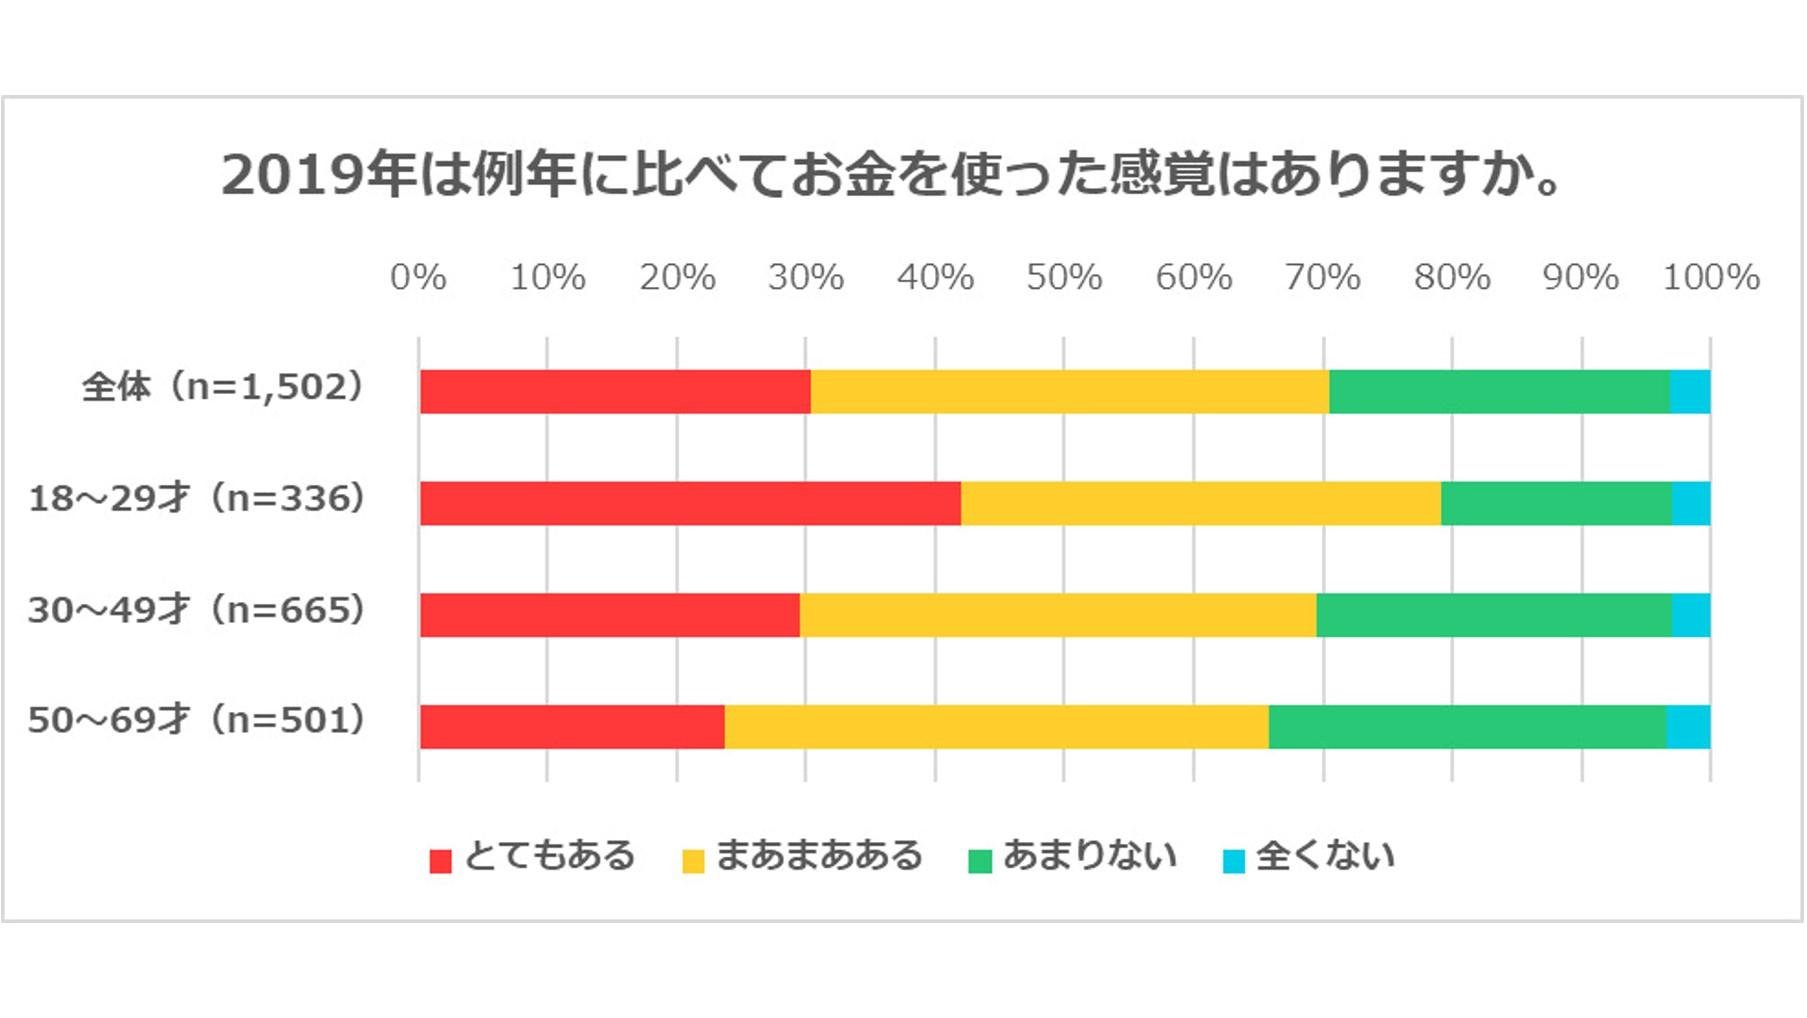
●70% of people spent more money than usual in 2019
What was the most expensive purchase? 1st place: "Travel" 2nd place: "Car" 3rd place: "Computer"
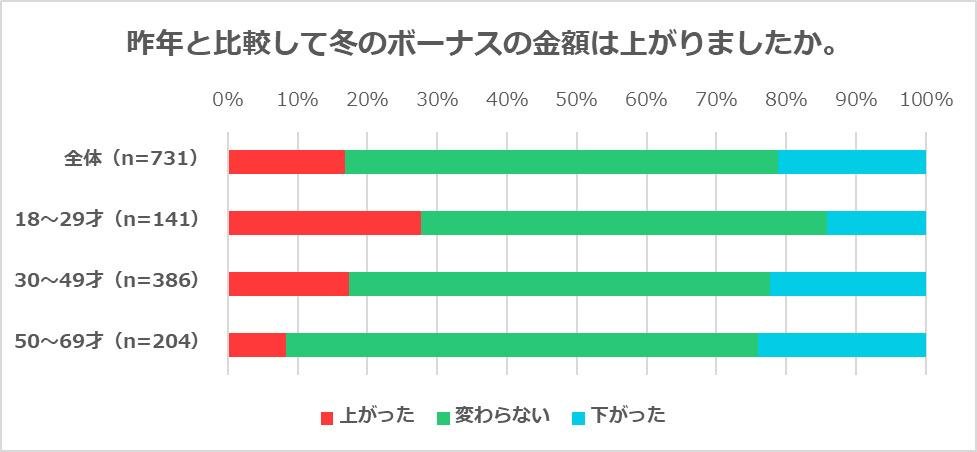
20% of people saw their winter bonuses increase compared to last year
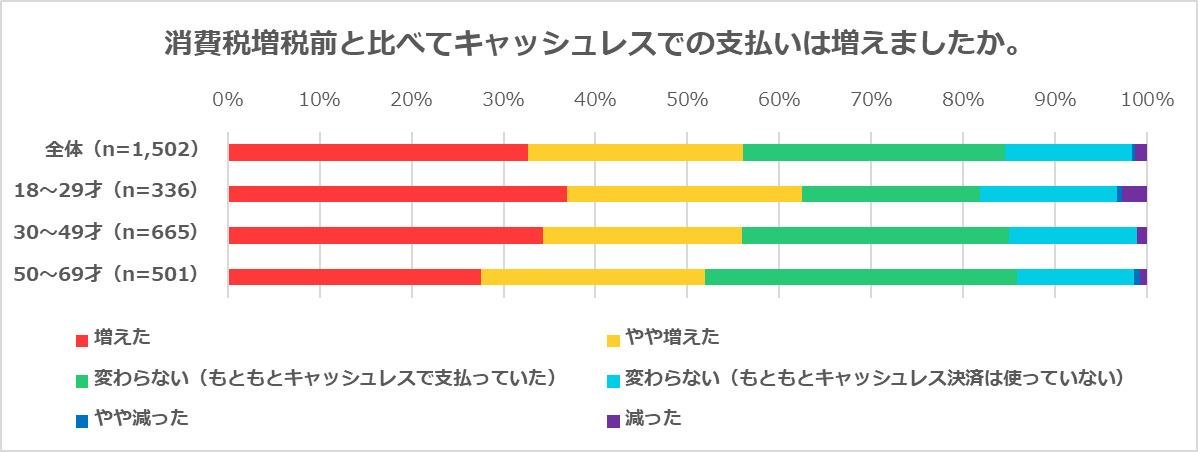
50% of people have increased their use of cashless payments compared to before the tax increase
●What subscription services do you usually use?
1st place: "Movies, dramas, and anime" 2nd place: "Music" 3rd place: "Books and magazines" 4th place: "Food" 5th place: "Games"
●50% of people have had tapioca milk tea this year, and 10% of women in their teens and twenties have made their own tapioca milk tea!
40% of people are considering purchasing disaster prevention products
●70% of people spent more money than usual in 2019
What was the most expensive purchase? 1st place: "Travel" 2nd place: "Car" 3rd place: "Computer"
There is only one week left in this year. This year has been full of big news, with the era name changing from "Heisei" to "Reiwa," the Rugby World Cup being held in Japan with the Japanese national team performing brilliantly, and the consumption tax increasing from 8% to 10%. Therefore, this T Survey focused on "consumption" and conducted a survey on attitudes toward consumption in the Reiwa era among 1,502 men and women aged 18 to 69.
First, when asked whether they felt they spent more money in 2019 than in previous years, a total of 70.4% of people answered "very much" or "fairly much." Looking at the results by age group, the figures were 79.2% for those in their teens and 20s, 69.5% for those in their 30s and 40s, and 65.9% for those in their 50s and 60s, with the number of people who felt they spent more money increasing with age.
In addition, when asked to give an open answer as to what the most expensive thing they had purchased this year was, the top answers included "travel," "car," "computer," "clothes," "refrigerator," "television," and "washing machine," indicating that people are spending quite a lot of money.
20% of people saw their winter bonuses increase compared to last year
50% of people have increased their use of cashless payments compared to before the tax increase
Next, we asked people who received winter bonuses this year whether the amount of their bonus had increased compared to last year. 16.8% answered "it had increased," 62.0% answered "it had remained the same," and 21.2% answered "it had decreased." This shows that while 70% of people felt that their consumption expenditures were high, the reality is that bonuses, which are income, did not contribute that much. By age group, 27.7% of those in their teens and 20s, 17.4% of those in their 30s and 40s, and 8.3% of those in their 50s and 60s saw their bonuses increase.
Additionally, when asked whether cashless payments such as those made using credit cards, electronic money, or smartphone payments have increased compared to before the consumption tax hike, 56.1% of respondents answered that they have "increased" or "slightly increased." This shows a gradual increase in cashless payments, perhaps due in part to point-rebate campaigns.
●What subscription services do you usually use?
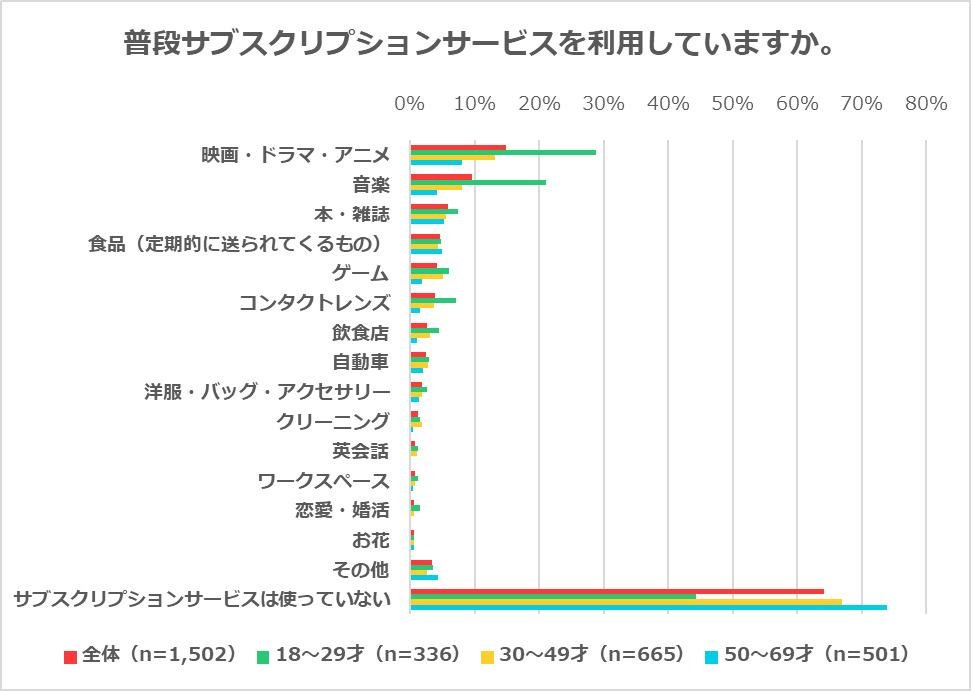
1st place: "Movies, dramas, and anime" 2nd place: "Music" 3rd place: "Books and magazines" 4th place: "Food" 5th place: "Games"
Next, in regards to subscription services, which have recently begun to increase as consumption trends shift from "ownership" to "use," respondents were asked to select multiple options regarding what subscription services they usually use. The top ranking was "Movies, TV dramas, and anime" (14.9%), second place was "Music" (9.7%), third place was "Books and magazines" (5.9%), fourth place was "Food" (4.7%), and fifth place was "Games" (4.2%). In particular, entertainment subscriptions are popular among people in their teens and twenties, with 28.9% choosing "movies, dramas, and anime" and 21.1% choosing "music."On the other hand, 64.2% of respondents answered that they do not use subscription services, suggesting that subscription services will become more widespread in the future.
●50% of people have had tapioca milk tea this year, and 10% of women in their teens and twenties have made their own tapioca milk tea!
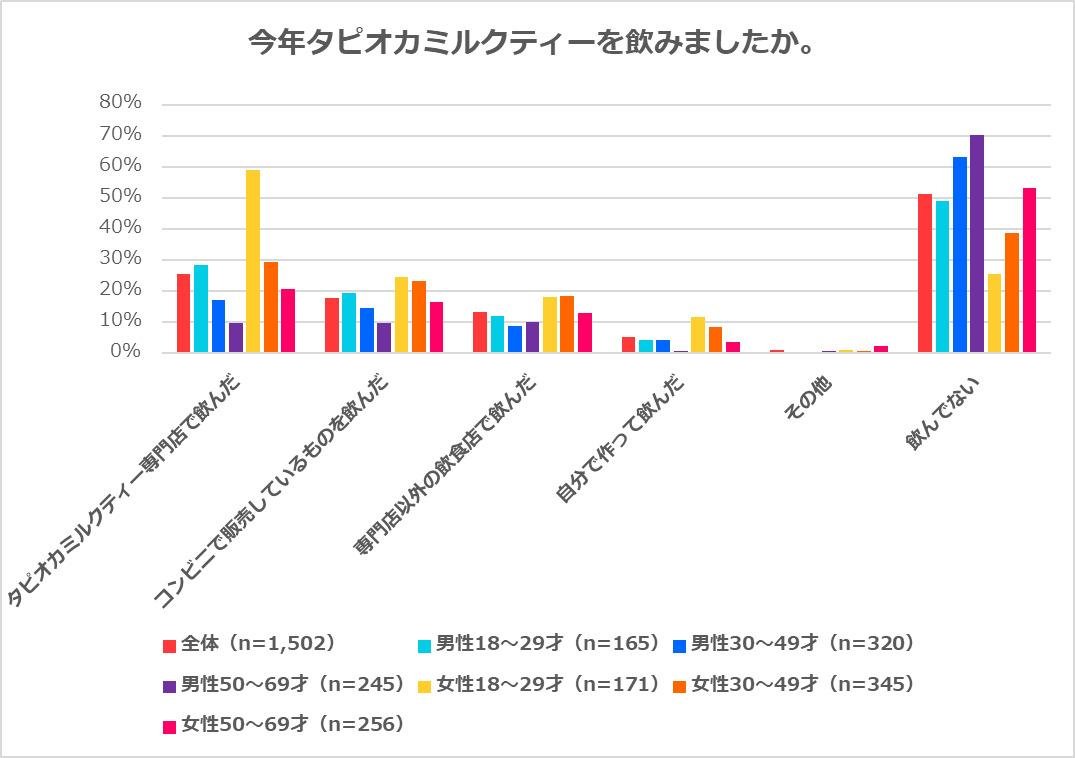
"Tapiru" (tapioca milk tea) was nominated for the New Words and Buzzwords Awards 2019. When asked to select multiple options whether they had drunk tapioca milk tea this year, 50% of people answered that they had drunk tapioca milk tea in some way. The breakdown of these responses was as follows: 1st place "drank it at a tapioca milk tea specialty store" (25.4%), 2nd place "drank it from a convenience store" (17.8%), 3rd place "drank it at a restaurant other than a specialty store" (13.4%), and 4th place "made it myself and drank it" (5.4%). More than 70% of women in their teens and twenties have drunk tapioca milk tea this year, with 11.7% responding that they "made it themselves."On the other hand, 70% of men in their 50s and 60s answered that they "don't drink tapioca milk tea."
40% of people are considering purchasing disaster prevention products
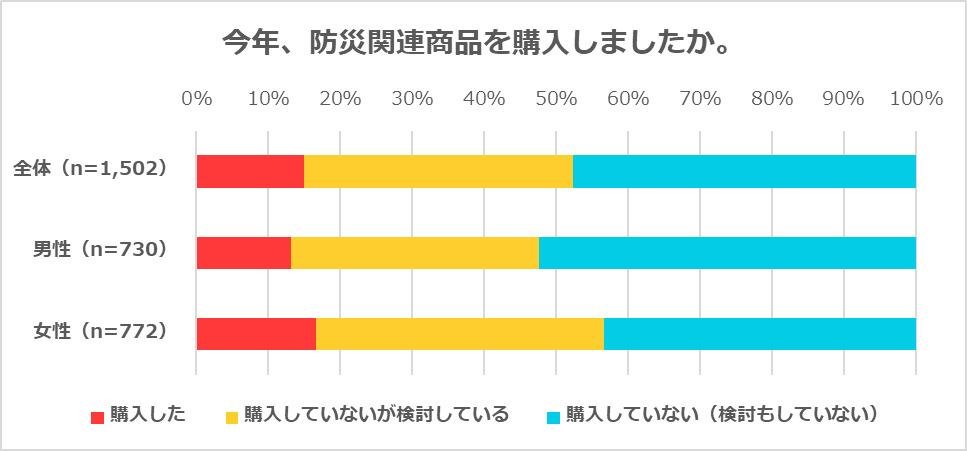
This year has seen a series of major typhoons and heavy rains causing damage, making it a year that has made us feel that awareness of disaster prevention is on the rise.When asked whether they had purchased any disaster prevention related products this year, 15.0% answered "Yes," 37.4% answered "No, but I am considering purchasing," and 47.7% answered "No, I have not purchased (nor am I considering)," showing that nearly half of the respondents have an intention to purchase disaster prevention related products. Women were particularly keen to do so, with nearly 60% saying they had purchased or were considering purchasing disaster prevention products.
■ Survey Overview
Survey method: Internet (T Survey)
Survey period: Monday, December 9, 2019 to Tuesday, December 10, 2019
Survey area: Nationwide
Survey subjects: Men and women aged 18-69 (T members)
Sample size: 1,502 people
Materials related to this matter
"Reiwa Consumption Survey" 70% of people said they "spent more money than usual in 2019," with the most expensive purchases being 1st "travel," 2nd "cars," and 3rd "computers."
Inquiries regarding this matter
Culture Convenience Club Co., Ltd.
Public Relations Officer: Ando
TEL: 03-6800-4464
If you resonate with the content of this site, please feel free to share it.


